Maximize the ROI of your intranet and Microsoft 365 with Atlas Analytics
Traditional usage analytics only tell part of the story. You need deep insights into adoption patterns to ensure your goals and KPI's are being met and if not, what to do about it.
And if you are hitting your goals then you need to be able to shout about it and have some great looking reports to go with it! Atlas Analytics provides the insights you need.
The benefits of using Atlas Analytics
Work smarter
Gain insight into content that is and isn’t being used and adjust your approach accordingly.
Shine a light on your organization
See how your people really network together.
Measure the impact of internal communications
Atlas Analytics lets you visualize how your message is moving through your organization, including its reach, reactions and which channels people are engaging with. This allows internal comms to refine their strategies to increase engagement.
Optimize adoption and transformation initiatives
Maximize adoption by tracking engagement across applications, identify users who aren't onboard or who have regressed and act to re-engage them.
Tell stories about your data
Modern analytics can be used to dynamically surface success stories by matching patterns in data.
Recognize key influencers
Recognizing key influencers and subject matter experts you may not have known you had will accelerate your project success.
Insight for innovation
Your data gives you the ability to see the connections, actions, and productivity of your people, allowing you to make better decisions and drive innovation.
Gain deep insight and measure results
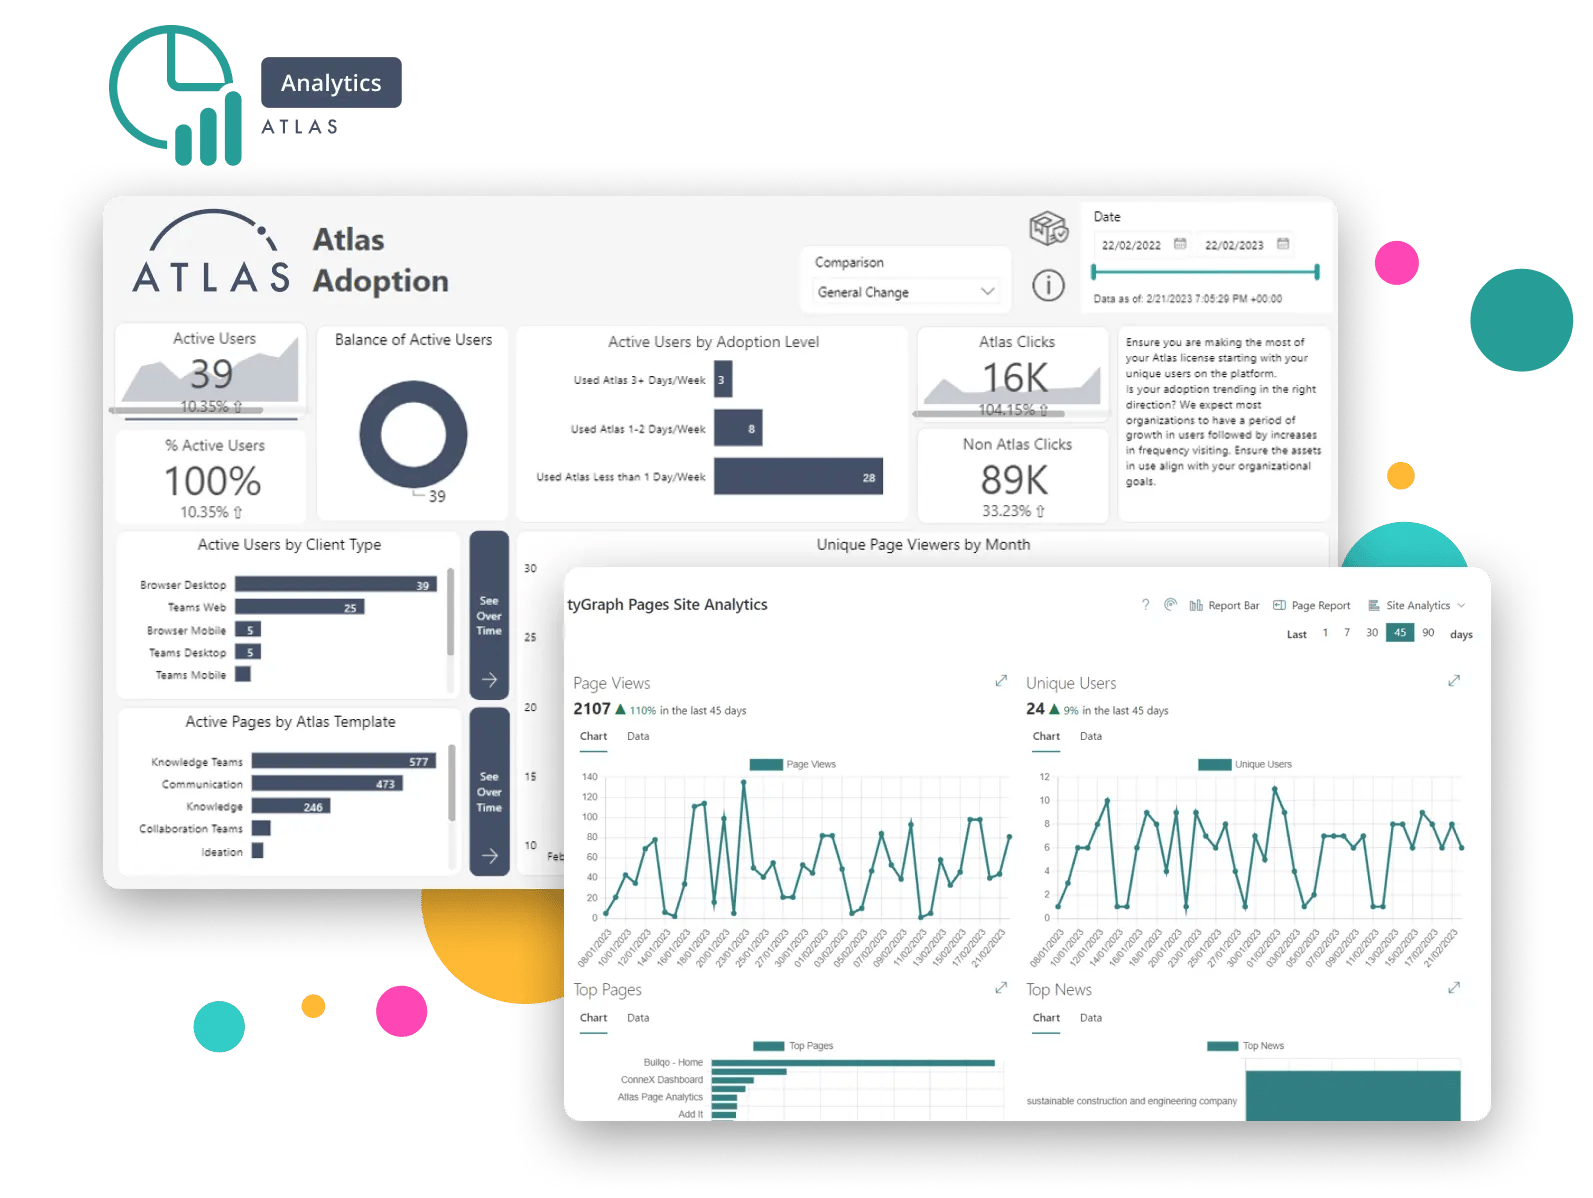
We partner with tyGraph to provide an award-winning suite of reporting and analytics tools for Atlas and Microsoft 365.
Provided within Power BI and available within Atlas pages.
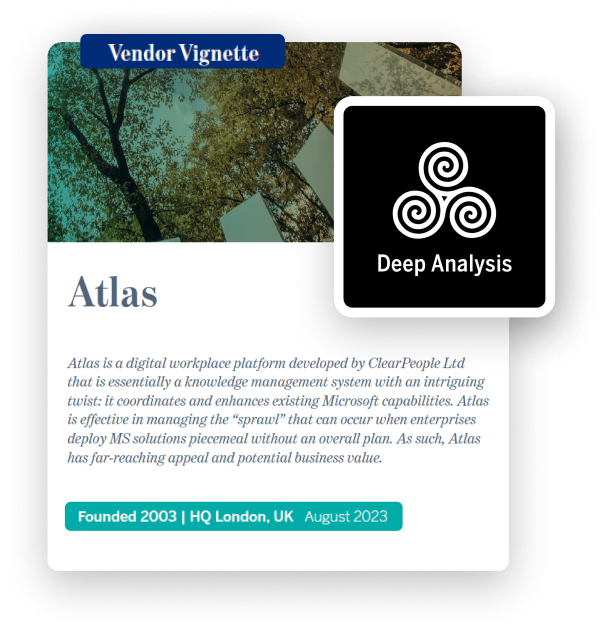
"Atlas transforms [Microsoft’s analytics and reporting capabilities] to embrace KPIs, making it as much about business management as about IT admin."
- Deep Analysis Report 2023
Atlas Analytics features at a glance
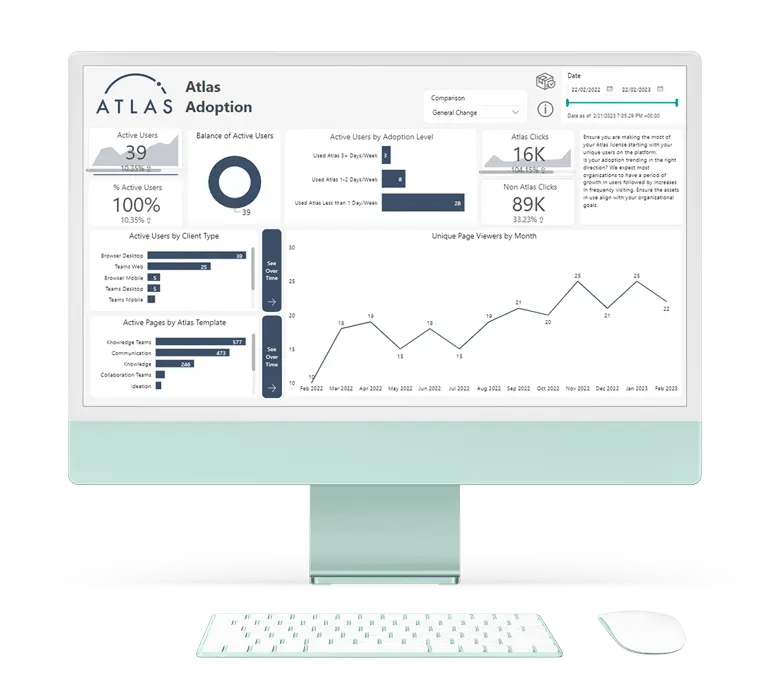
Adoption
Instant summary of adoption trends. You can see how many users are enabled, how many people are actively using Microsoft 365 and more.
Collaboration
See trends and usage of OneDrive or SharePoint to store documents and for collaboration. You can also see how many documents are shared internally or externally.
Usage
Use the reports in this section to learn how people in your organization are using Microsoft 365, with volume of active users and the key activities for each product.
Communication
Observe shifts in the ways your people use communication tools.
Mobility
Track which devices people use to connect to email, Teams, SharePoint etc.
Atlas offers even more analytics options
If you want to go further with analytics, we won't hold you back. The Atlas Digital Workplace platform has options for advanced analytics that can be implemented in hours and work alongside the usual analytics reports, delivering more insights.
Discover Analytics with Atlas
Book a demo with one of our experts now if you want to get the most out of your Microsoft 365 investment and discover powerful analytics capabilities.


/Product/Reviewed%20new%20images/Analytics/Analytics%20Screens%201.webp?width=1563&height=1198&name=Analytics%20Screens%201.webp)